Atlantis, Integrated Systems Analysis of Energy
Building local energy-planning capacity in countries can greatly benefit from an open, accessible, transferable, yet powerful modelling package. UNDESA, in partnership with KTH-dESA, has piloted capacity development in selected countries to support country efforts in medium-long term energy planning and it is now initiating projects in new countries. These projects preferentially use the Open Source Energy Modelling System model (OSeMOSYS), a powerful yet open, flexible and transferable tool. To further facilitate capacity development and model improvement, UNDESA and KTH-dESA have developed a browser based interface for OSeMOSYS, the Model Management Infrastructure (MoManI). MoManI can provide development and energy planners with the tools required to construct models, explore scenarios and visualize results.
Supporting Skills Building for Energy Planning: OSeMOSYS
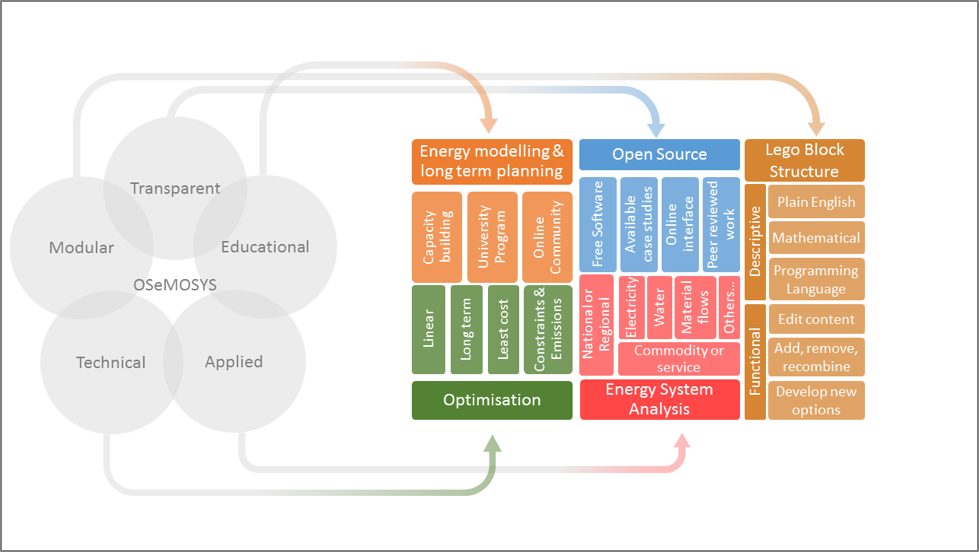
The Open Source energy Modelling System (OSeMOSYS) offers an interesting alternative to traditional cost-optimization planning tools. Based on a “lego-type” modular framework, it allows users to tailor their analysis to a large range of interconnected systems and appropriate mathematical formulations. Fully transparent and documented, OSeMOSYS is well suited for both capacity building and model based energy planning.
More information on OSeMOSYS can be found on www.osemosys.org, and in recent publications.
Facilitating Energy Modelling: MoManI
To facilitate the use of OSEMOSYS for capacity building and model-based planning, UNDESA and KTH-dESA (with support from the IAEA and Tartu University) are developing the OSeMOSYS Model Management Infrastructure (MoManI) interface. In its version V0, MoManI supports:
- Model building: from changing the mathematical equations of OSeMOSYS to defining the energy system and data population, the interface assists the user during the building and editing process of country models.
- Data transfer: a particularly useful feature for large-scale projects. MoManI allows for easy and quick data transfer from excel or other formats.
- Results visualization: fast, flexible and quick visualization of results, which can then be exported or printed.
- Web-browser capabilities: available as an offline tool, the interface can also be used with the full advantage of its browser capabilities. This allows people in different locations to develop together a model sharing code, edits, updates, and benefiting from the feedback of shared results visualisations.
An illustration of Energy Systems Modelling: Atlantis
To illustrate some basic features of energy systems modelling using OSeMOSYS and its interface MoManI, we present an exercise that uses data for a fictitious country that shares features of both a developing and a developed country. We call this country Atlantis.
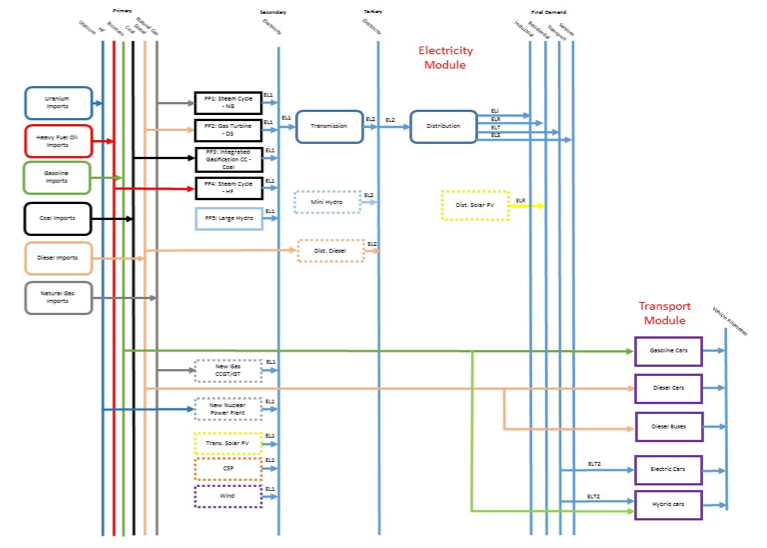
The main features of Atlantis’ energy system are described here. Atlantis relies on 5 power plant types to meet its electricity demand, each plant running on a single type of fuel. The first power plant is a large hydro power plant. The second and third plants are Single Cycle Steam Turbine, one running on natural gas while the runs on Heavy Fuel Oil. The fourth power plant is a Gas Turbine fed by diesel. The last is an Integrated Gasification Combined Cycle facility fed by coal. In addition to these, in a large number of rural areas electricity generation comes from distributed diesel generators. Atlantis imports 100 per cent of its fuels.
The Atlantis model will explore the feasibility of generating electricity from:
- Wind Turbine (25 per cent load factor).
- Mini Hydro power plants (less than 1 MW).
- Concentrated Solar Power (CSP).
- Grid connected PV system. (Commercial).
- Rooftop PV system (in residential areas).
- Nuclear power plant (light water reactor).
- A New Combined Cycle power plant running on Natural Gas.
The interactive visualization presents results for four scenarios: a reference - so-called business as usual (BAU); one where the country achieves universal access to electricity by 2030; another setting a 50 per cent target of electricity generation from renewables; and a climate change scenario.
The Reference Energy System of Atlantis
Getting Started with MoManI
Results, Scenarios and Visualization
BAU
The business as usual (BAU) scenario shows the current energy system in Atlantis. Household consumption assumed for this scenario is 400 KWh. Optimization results suggest investing in new technologies rather continuing using pre-existing
capacity in the system. In other words, optimization suggests it is more cost effective to invest in new technologies and let idle or underutilised some of the pre-existing capacity than continuing using these simply because they are already
installed. Results also show that new investments in hydropower can play a key role in the future. Considering its potential, hydro can supply more than 50 per cent of the country’s electricity requirements by 2030 with corresponding investments
focusing on mini-hydro technologies.
100% Electrification
In this scenario the household demand was increased to 2,200 KWh, as per Tier 5 of the Global Tracking Framework. Optimization results show, again, that hydropower is the least cost technology option for meeting the increasing demand. With
the given cost and performance data, distributed diesel generators are not competitive with the low-cost electricity generated from hydropower. In this scenarios there is a limited contribution of solar power to the total energy mix due
to the relatively high cost of this technology.
50 per cent Renewable Energy Target
This scenario studies the feasibility of increasing the share of (non-hydro) renewable energy to account for 50 per cent of the total generation mix by 2030. Optimization results suggest that renewable investments should focus on wind energy
as it has greater potential to meet such green targets. The penetration of solar power is highly dependent on the investment cost associated with technology learning. If these costs go down, this technology may take a greater role. Not simulated
here, such dynamics can easily be introduced.
Climate Change Adaptation under a target 100% electrification rate
One of the expected effects of climate change is the alteration of rainfall patterns. In this scenario, the focus is to adapt to a reduced water availability in the hydro system and its impact on electricity generation. The system optimization
shows that to properly compensate for the decline in hydro potential investments in solar technologies should be made at a very early stage, both at a grid and a private residential levels. Since this scenario also targets 100 per cent electrification,
rooftop solar PV will supply about 60 per cent of the new electrification demand in rural areas, compared to a 15 per cent share of diesel generators. Combined capacities of Concentrating Solar Power, wind and nuclear will compensate for
the faltering hydropower generation, causing a significant increase in investment requirements.
How to Use this Tool
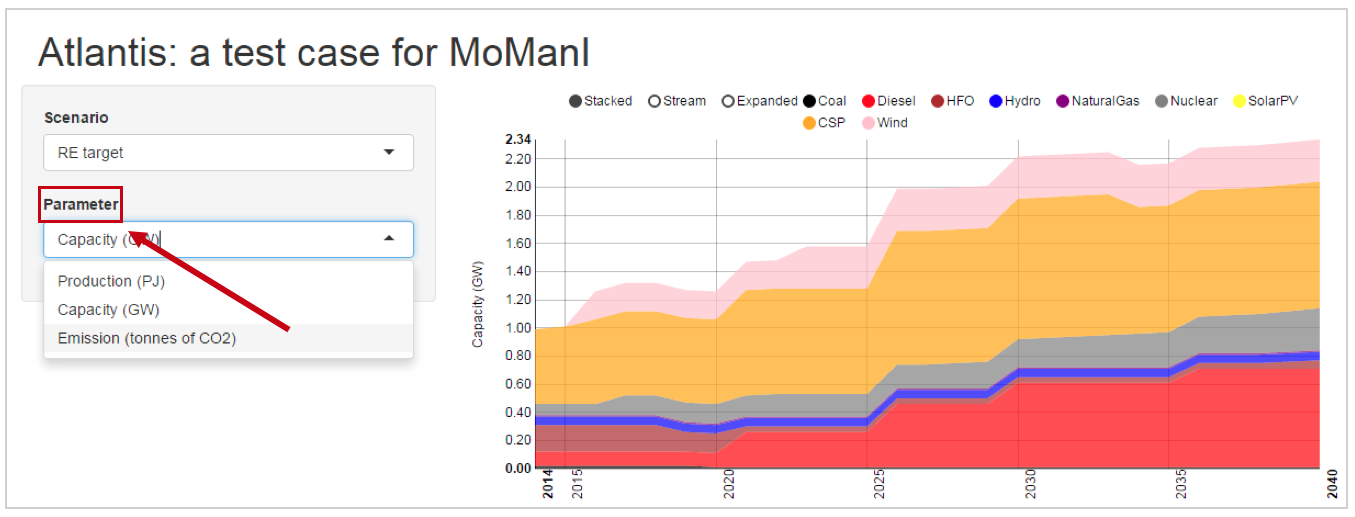
The visualisation displays results for four scenarios. These are defined by: a) BAU; b) Electrification; c) Climate change adaptation; d) RE target. Implementation of renewable policies follow specific time patterns, as described in the supplementary material. For each scenario, the visualisation displays results for electricity generation by source, total installed capacity and total CO2 emissions.
The user can select different scenarios and outputs to browse through the results from the model. The basic layout of the results visualisation page contains a sidebar with selection options and a main panel, to view a specific result.
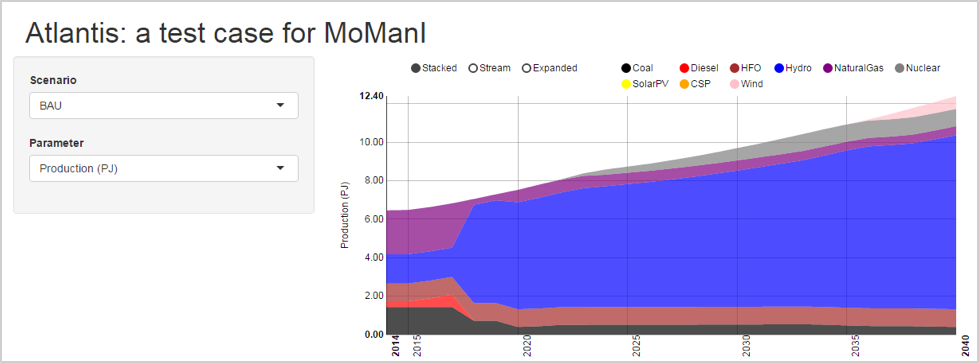
To view different scenarios, click on the ‘Scenario’ drop-down menu on the left of the page.
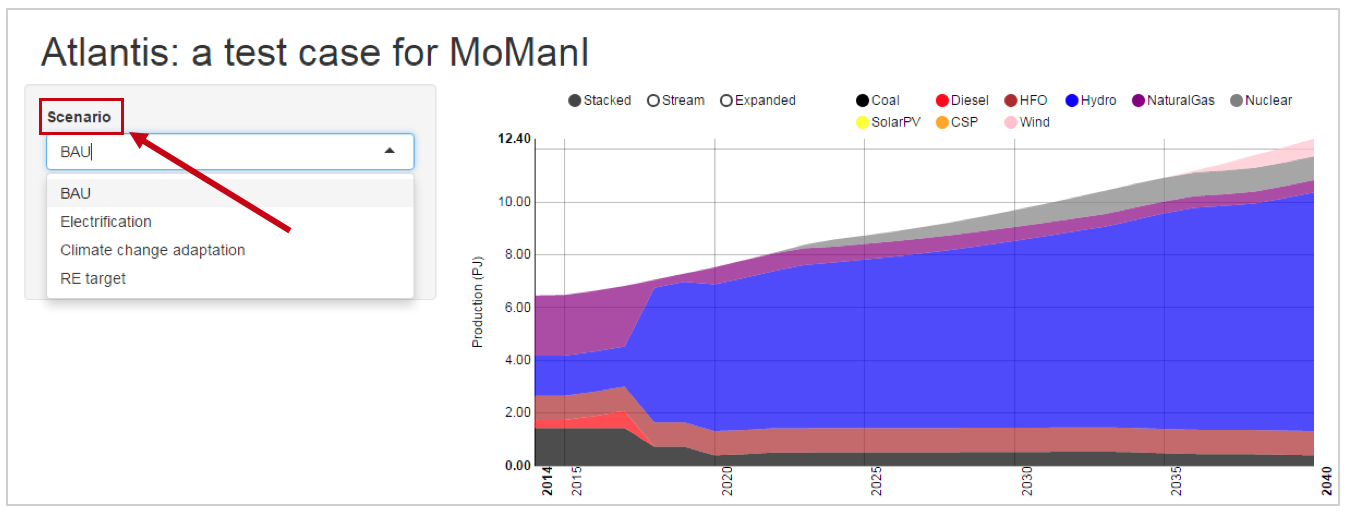
To view different output results for each scenario, click on the ‘Parameter’ drop-down menu, also in the panel on the left of the page.